Architecture Development
this page describes the various aspects of the elaboration of a future platform architecture.
|
Current Architecture
In a first step existing systems and tools are analysed.
The topology shows the various systems and its current owners.
For those systems the business objects were determined and in a second step the workflows between the business objects.
All information is stored in Enterprise Architect in a common UML Model. A HTML copy of the model can be found here: UML Model
Topology
The topology shows currently existing systems and tools that are analysed in details. The following links guide you to the corresponding architecture models
The main systems are:

The topology can be found here: UML Model - Topology
The following picture shows the platform coverage

Business Objects
The business objects describe in an abstract way the basic objects of todays systems.
They are described in the UML Model for the above mentioned systems

The topology can be found here: UML Model - Business Objects
Detailed Business Objects are available for
Workflows
The workflows describe the interaction of the business objects of todays systems

Each workflow is described with a swimlane diagram in details

Workflow diagrams and swimlanes can be found in the UML model for each of todays systems.
Please refer to the detailed diagrams in the subdirectories of the UML Model - Business Workflows.
Messages and Data Objects
An overview of all messages exchanged with the related data objects in the current architecture landscape can be found as a list in the following document in Teams: [Messages and Objects]
Refer to the sheet Messages.
Perspectives
Based on the business objects and workflows of todays systems the services are extracted into abstract layers combining services from various systems.

Steps
The steps (see bullet points) for doing that are:
- Describe the processes and platforms (done in the current architecture)
- Remove platform borders keeping processes and objects
- Analysis of the services based on vision, governance and principles
- Aggregation of the found limitations
- Description of gaps (based on found limitations)
- Align services towards future architecture
Perspectives and links to Processes, Objects, Limitations and Capabilities
Each perspective is assigned to a process and contains the process steps taken out of one of the systems currently covering this perspective. In the UML model the perspectives are described in detail. The following picture shows what can be found for each perspective.

In the upper area of the perspective you find the Processes that are covered with this perspective. Below the Workflows for RUs and Partners as well as additional Digital Platform Workflows are described using swimlanes.
Use cases are described in the form of bubbles, showing involved actors.
Business Objects (blue) and Masterdata (grey) covered by this perspective are described in the lower area of the perspective.
Limitations found in the current perspective are positioned where they occur (activity, business object or below the processes for general limitations) and described with boxes (orange/brown).
Sector Initiatives belonging to this perspective that are not yet covered by a system or not yet described in the UML model are described with arrow-boxes (green).
Limitations are described in detail in a separate document. This document can be found here: [List of Limitations]
Todays Perspectives
The following perspectives were identified. The ones that contain a link are already defined and described in the UML Model.
- Train Service Planning
- Train Preparation
- Train Operation
- Wagon Status
- Wagon Performance
- Wagon Damage
- Wagon Check
- Order Consignment
- Braking Rules
- Rolling Stock Dataset
- Shipment Booking
- Shipment Status
Further possible Perspectives
Addtionally the following possible perspectives were identified. These perspectives may be analyzed in a later step.
- Transport Planning and Preparation
- Driver Service Book
- Driver Route Knowledge
- Locomotive Service Book
- Locomotive Master Data
The perspectives can be found in the UML Model
The list of limitations can be found here: [List of Limitations]
Non-Functional Requirements
Non-functional requirements describe additional requirements besides those derived from business objects and workflows
Basic Principles
The following basic principles can help to find non-functional requirements:
- Authentication and Security
- Small-Player Access to Services
- Traceability
- API Management
- Testing and Integration
- Service Behaviour
- Security and Redundancy
Non functional requirements were analysed together with the limitations and capabilities were defined, that on the one hand solve existing limitations but on the other hand also cover non-functional requirements.

A detailed description of the basic principles can be found here: [Basic Principles]
The list of non-functional requirements can be found here: [Non-functional Requirements]
Limitations
When talking about limitations, we are in the World of Problems.
Based on the description of the current systems with its business objects and workflows the limitations of todays systems can be analysed by making use of the perspectives.
Methodology
- Limitations are identified in workshops based on the perspectives
- Limitations found are documented in a spreadsheet and in the UML model
- in order to cluster the limitations
- duplicates are eliminated (in the spreadsheet)
- dependencies between limitations are documented in the UML model
- then the limitations are grouped into limitation groups in the UML model
- for each of the groups the benefits and impacts are defined
- all the groups are categorized in low, medium and high priorities
Criteria
The criteria to select potential limitations are:
- Constitutional Governance
- Data Governance
- Service Shaping
- Accessibility
- Integration
- Master Data
- Identifiers
Priorities
All limitations are analysed and priority for each limitation is set according the following criteria and scores
Priority Criteria
Problem Area (PA)
| If the limitation belongs to problem area | then the score is |
|---|---|
| Data Quality | 3 |
| Coverage (Governance) | 2 |
| Functionality / Business Processes | 1 |
Level (L)
| If the limitation belongs to level | then the score is |
|---|---|
| L1 | 3 |
| L2 | 2 |
| L3 | 1 |
Dependencies (D)
| If the limitation has the following dependencies | then the score is |
|---|---|
| other limitations are dependent on this (predecessor) | 3 |
| this limitation has no dependencies | 2 |
| this limitations depends on other limitations | 1 |
Value Added (V)
| If impact of the limitation is | then the score is |
|---|---|
| big | 3 |
| medium | 2 |
| small | 1 |
Effort (E)
| If the implementation effort of the limitation is | then the score is |
|---|---|
| small | 3 |
| medium | 2 |
| huge | 1 |
Weighting
For each of the above mentioned criteria a relative weight is defined
| Criteria | Weight |
|---|---|
| Problem Area (PA) | 3 |
| Level (L) | 1 |
| Dependencies (D) | 2 |
| Value Added (V) | 3 |
| Effort (E) | 2 |
Ranking
Based on sum of the scores of each criteria, multiplied with the weighting of the criteria an individual priority of each limitation results
Priority = (Score PA * Weight PA) + (Score L * Weight L) + (Score D * Weight D) + (Score V * Weight V) + (Score E * Weight E)
The priority of each limitation varies within the range of 1 and 10.
The higher the priority value the higher the ranking of a limitation.
SAFe Ranking
The limitations were ranked additionally according to the SAFe Methodology (Scaled Agile Framework) in order to analyse the limitations in a longer planning horizon and set priorities accordingly.
The lower the SAFe for a limitation, the higher is the priority to act.
SAFe = Score E / Score VA / Score PA
- the higher the effort, the higer the SAFe, meaning, the lower is the priority to act.
- the higher the value added and/or the problem are, the lower is the SAFe, meaning, the higher is the priority to act.
Conclusion
Based on the above described methodology the following 26 highly ranked limitations were found

When looking at the coverage of the various clusters, the following picture shows up:


The first 19 of the top 26 limitations are related to Data Quality (out of 21 limitations), 4 limitations are related to governance and 1 limitation is related to functionality. Within the first 26 top ranked limitations business related limitations cannot be found.
Documents
A detailed description of the weighting criteria can be found here: [Criteria for Limitations]
The list of limitations can be found in the following spreadsheet: [List of Limitations]
An overview of all limitations can also be found in the [| UML Model]
Additionally you find the dependencies of limitations in the [| UML Model]
Capabilities
When talking about capabilities and gaps, we are in the World of Solutions.
Capabilities are derived from the limitations by taking into consideration the vision, governance and principles layed down by the CIOs.
Gaps result when future capabilities cannot be fulfilled with existing systems due to limitations of the existing systems.
They are the basis for the planning of development initiatives.
Methodology
Based of the priorised groups of limitations the capabilities are elaborated:
- Definition of the capabilitity targets (what do we want)
- out of the limitations
- from platform requirements
- from the vision
- Link the capabilities with the groups of limitations
- Elaborate the gaps between the groups of limitations and the expected capabilities
- Work out solution variants for the gaps, clearly describing
- functionality
- implementation effort (T-Shirt size, XS-S-M-L-XL)
- implementation duration
- affected stakeholders
- Assess the solution variants
- Decide about the final solution variants to be implemented
The result of this work is a backlog of solutions, that can be implemented in the World of Implementation.
The capabilities can be found in the UML Model.

They are linked with the limitations and non functional requirements.
Details can either be found directly in the Capability object or in the capabilities sheet [here].
Capabilities Overview
The following areas were considered when looking for future capabilities. The links refer to the UML model, where you find the details for the capabilities of the corresponding area.
- Location Identification
- Train Identification
- Train Operations
- Wagon Status
- Wagon Damage
- Wagon Performance
- Rolling Stock
- Train Preparation
- Braking Rules
- Shipment Booking
- Shipment Order
- Train Service Planning
- Intermodal Traffic
Weighting and Ranking
All capabilities found were evaluated and a weighting added to each of the capabilities. The following approach was used to rank the capabilities:
Select Capabilities Along Limitation Ranking
- All limitations with a priority higher than 8 were selected, which results in 26 limitations
- All capabilities that solve these limitations were selected and the priority of the capability was set to the priority of the limitation with the highest priority
This results in 22 capabilities
Independent Evaluation of all Capabilities
All capabilities were evaluated independently as follows
estimated the cost of each capability
(3=low/<200k€, 2=medium/200k€-1M€, 1=high/>1M€)estimated the benefit of each capability
(3=high, 2=medium, 1=low)calculated the SAFE-factor for each capability
SAFE = 1/cost/benefit (SAFE varies between 0.11 and 1)excluded the capabilities already ranked along limitation ranking
sorted remaining capabilities according to ascending SAFE
selected capabilities with a SAFE-factor = 0.11
This results in 14 capabilites
Additional Capabilities
At the end additional capabilities were selected that have a link to one of the above selected capabilities, since these capabilities have to realized together with the already selected capabilities in order to achieve the expected result.
This results in 18 additional capabilities.
The 54 selected capabilities (of 105, 51%) solve at least 75 limitations (of 201, 37%)
Conclusion
The 54 capabilities found cover almost all clusters

Within these 54 capabilites, only capabilites for Braking Rules do not appear. Their ranking is too low to appear in the list of ranked capabilities.
When clustering the 36 main capabilities (without the related ones), the following situation shows up

In the overview document of all capabilities (here), an even more detailed view of the capabilities and the covered limitations can be found.

The list of capabilities can be found here: [| List of Capabilities] (as part of the List of Limitations). Each limitation described in this document has a link into the UML model.
Capabilities can also be found in the UML Model directly: [| here]
Data Objects
Objects of Existing Platforms
Based on existing platforms, objects were identified that will also be the basis for the future platform.

see |UML-Model
Considered Platforms and Objects are:
- Xrail (yellow)
- Shipment
- Transport Plan
- Booking
- Trip Plan
- ETA Deviation
- RNE (red)
- Train Running Information
- Path Coordination
- Path Details
- Train Route
- Case Reference
- Train Service
- RailData (green)
- Wagon Status
- Consignment Note
- Train Composition
- GCU (blue)
- Wagon Performance
- Wagon Damage
- Wagon Technical Data
- Rolling Stock Data Set
Access Rights
For each of the above mentioned objects and all their attributes the accessibility on the future platform was defined. The following levels of accessibility were defined:
| Closed | no data exchange is allowed |
|---|---|
| Restricted | object is visible and accessible within the future platform if there is a contract or license to use the information |
| Internal | object is visible and accessible within the future platform if role using the object is involved in the corresponding traffic or transaction |
| External | object is visible and accessible by everybody |
per default, the access right to an object in the future platform, the level is Internal.
Stakeholders and Roles
Roles
Stakeholders accessing the objects on the future platform can have different roles. For each of these roles, the access rights to the objects can be different.
The following roles were identified:
| Roles |
|---|
| Lead RU |
| Participating RU |
| Wagon Keeper |
| Infrastructure Manager |
| Yard Manager |
| Customer |
| Freight Forwarder |
| Port Authority |
| Terminal Operator |
| Intermodal Operator |
| Customs Handler |
| Third Party |
| Wagon Maintenance Workshop |
Primary and Secondary Receivers
For the stakeholders primary and secondary receivers were differentiated:
| Role | Colour | Description |
|---|---|---|
| Primary Receiver | green | a primary receiver needs the object/information in order to properly handle its business |
| Secondary Receiver | yellow | secondary receivers are interested in the information helping them to handle their business but the information is not mandatory to manage the business. |
Object - Stakeholder Matrix
For each combination of object/attribute and stakeholder/role the access right of that stakeholder/role to the object/attribute was defined according to the defined access right levels.

Example: access rights of Train Composition object and its attributes (grey fields: not of interest, green fields: primary receiver)
The full matrix can be found here: [Object - Stakeholder Matrix]
Analysis and Conclusions
Distribution of Stakeholder

63.3% of new stakeholders making use of the objects provided on the future platform are RUs. So RUs profit most from the addtional information provided on the platform.
On the other hand a third of the new stakeholders are none-RU stakeholders. This is an opportunity to sell the services of the new future platform to interested parties.
Primary Receivers

97.5% of the objects necessary for a primary receiver to do the job have an access level of internal, meaning that the receiver can access the object for the corresponding transaction or traffic.
Secondary Receivers

More than half of the objects can be accessed by the secondary receivers on an internal level. For a third of the objects/information the secondary receiver needs a contract or license to access the information.
Only 8 % of the objects/information is not accessible by secondary receivers.
Consumption of Objects

When looking at who is consuming information it is interesting, that customers, freight forwarders, intermodal operators, customs handlers and third parties profit as secondary receivers from the objects/information provided by the future platform
Existing receivers like RUs, wagon keepers and IMs only profit limited from the additional objects provided, but several new receivers like yard managers, port authorities and terminal operators can profit massively from the new platform.
Smart Services
Smart Services are proposals of solutions for gaps and limitations.
A [list of Smart Services] with a short description, issuer, comments and priority can be found in the files area.
Target Architecture
This chapter describes the methodology to find the target architecture as well as the overview of the future target architecture with its basic framework concept.
The architecture is based on the capabilities and smart services and has the aim to close the identified limitations.
It takes into account non-functional requirements.
The role of the RU community
In order to build up a future architecture, the RU community takes an important role.
It
- coordinates all RU interests
- represents small and large RUs
- acts as a cooperation body between RUs, Wagon Keepers, IMs (RNE) and other interested third parties.
- has the force to harmonize strategically and tactically
- can provide lobbying and marketing
- can participate as strong partner in standardization efforts

Platform Approaches
Todays Situation
Today, each participant in the railway business has to connect itself to a variety of tools and platforms in order to exchange information with other participants.

Pilot for new Digital Platforms
Instead of decomposing and rebuilding todays available and proven platforms and tools a hub could be built up that hides todays platforms and tools and provides unique access in one place. The functionality of the hub can be reduced for small RUs and can provide various interaction possibilities for large RUs.

The advantage of this pilot are:
- Fast integration of available platforms and tools
- One single "Point of Contact" for RUs to exchange information
- Independence of the participants from changes in the underlying platforms and tools
Evolution to Smart Services
Once these hubs are established, the underlying platforms and tools can be decomposed into smart services and new services can be added.

In order to take the preferable out of the existing platforms, tools and systems, the best of all of todays applications can be selected and new smart services be built around this best breed.
The RU community has a lot of opportunities and unique selling propositions to build up such an integrated platform:
- Best Governance
- CEO Integration
- EU Lobbying
- 450 Members
- Long Term Experience (25 years +)
- All major use cases covered
- agile and flexible approach
- modern IT platform
RU Integration
After the pilot phase the hub becomes the stable RU interface in three flavors for the A, B and C type RUs (-> Glossary) demands. It offers
- one
- reliable,
- stable
interface for the specific demand of each RU type. It forms a Facade for the RU data exchange.
Integration with partners
The next level of integration is about the RU to partner communication. This includes
- Infrastructure Manager Broker
- Auth Broker
- WagonKeeper Broker
- Inter-modal Operator Broker
communication. To build up a stable, standardized digital data exchange is important for all communication partners. The architecture foresees a Broker to group the functionality needed in these data flows. The Broker will serve as a bridge and collects all services needed to enable and simplify the digital message exchange between the partners. It establishes a channel for the specific data exchange.

Organization
Todays Situation
Each existing platform today has a management organization, a business team and an IT design and service team.

Future Platform Organization
When moving towards an integrated RU platform a new organization has to be established, consisting of a new management organization, a new business experts group and one or more IT design and service teams. Participants of the new platform organisation have to take seat in the management and business experts teams of existing platforms that are not incorporated into the RU platform but interact with this new platform

Platform Framework Concept
When building up an integrated RU platform, this platform has to provide, some important basic services in a framework besides the provisioning and distribution of data. These basic services are described in this platform framework concept.
Overview
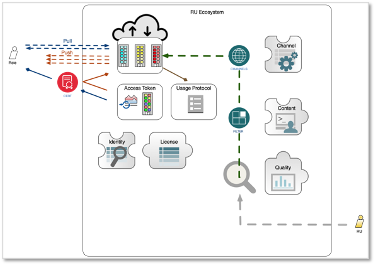

The Services
The services defined to operate the platform and to offer the basic infrastructure are called Facility Services. In the first analysis the following services have been identified.
Quality Service

The quality Service provides a centralized monitoring of the quality of the data delivered to the platform.
It monitors
- the quality of each data item delivered to the platform
- the availability of data
- the volume of data
It provides
- KPIs, thresholds and semaphores to the RFF board
- reports to RFF board and participating parties about the quality levels
Content Service

The Content Service provides means to interact with the data provided by the producers of data.
It allows to
- filter
- aggregate
- anonymise
- generate information
- store data intermediately
It checks if access to data is allowed, based on the Identity Service.
It provides access to the data through the Channel Service.
Identity Service

The Identity Service provides information about rights and duties of human and system users.
It provides
- User Management
- rights and duties of human users
- rights and duties of systems
- information about rights and duties to other services within the RU platform
- protocol information to the Quality Service regarding access violations
- security checks based on given tokens and access protocols
License Service

The License Service manages contracts and licenses
It allows
- to manage contracts and licenses
- to notify about timed-out licenses or contracts
- to notify about billing and invoicing
It informs the Identity Service about new, changed or expired access rights of a license or contract
Channel Service

The Channel Service provides a clear definition of offered active communication protocols
It
- is a decentralized service offered by each platform system.
- provides a channel management (who is providing what in which format with which technology)
- ensures that offered channels are available and operating
- regularely checks the availability of end-to-end communication chains
- provides integration blueprints and basic functional test capabilities
- provides specifications for format conversions
Migration Path
When talking about migration, we are in the World of Implementation.
Based on the Basic Principles, limitations and capabilities and the backlog of solutions, work packages are defined for each iterative sprint like a shopping list.
Basic Principles
Out of the five defined basic principles, the CIOs decided to focus on Coverage and Data Quality for the first iteration phase.

Data Quality: Monitoring and improving the Data Quality in the existing services
Coverage: Increase the Coverage by simplifying the connectivity and tools fro smaller to smallest RUs.
Integration Dimensions

A migration can follow different paths of integration. E.g. you can first focus on defining and implementing framework services before migrating services. Or you can first define and implement a future platform by working together with external partners, then implement the services for small RUs and migrate these RUs to the platform, and so on...
Based on the selected Basic Principles, the following integration dimensions are set:

This results in the following topics:

Focus on
- Data Quality of the services provided by the future platform framework
- implementation of a hub as first migration step providing access to existing systems
- web based solutions for small RUs
Workpackages
Based on the selected Basic Principles and Integration Dimensions the related capabilities and non-functional requirements are choosen, which will be implemented first.

Besides the functional and business requirements (covered by the selected capabilities) also logical and technical issues have to be considered in the first iteration phase.
Shopping List
For the first iteration phase, the following capabilities focusing on Data Quality and Coverage were selected with the following set of logical and technical aspects, together defining the Shopping List for the first iteration phase.

The shopping list can be found [| here].
Implementation
Based on the shopping list, the first iteration phase can be implemented resulting in a first version of the future RU platform
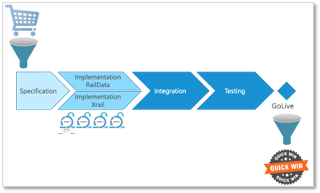

Benefits and Quick Wins

Ressource Planning
Based on the selected basic principles, migration path and the shopping list a resource planning for the first phase of implementation has been worked out. The results can be found [here].